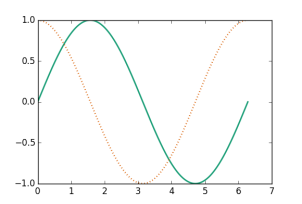
 So it seems matplotlib has only four defined linestyles, personally I quite dislike them. The worst thing about the “dotted” style is if you increase the linwidth, it just increases the width of the erstwhile dots in only one direction and they end up looking pretty much like railway track sleepers (without the tracks) than dotted lines.
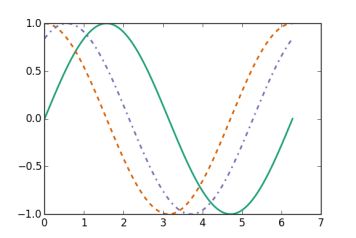
But as is often the case with matplotlib there is a ridiculously easy way around it and that is to define your own linestyle. You can define a series of on/off lengths as a list like [5,2,3,1] which means 5 on, 2 off, 3 on, 1 off and so on. Works absolutely a charm. Here is an example
plt.plot(x,np.sin(x),lw=2,dashes=(None,None))
plt.plot(x,np.cos(x),lw=2,dashes=[5,5])
plt.plot(x,np.sin(x+1),lw=2,dashes=(5,5,2,5))